
- How to Migrate from Rank Math to SureRank
- How to Migrate from Yoast to SureRank
- How to Migrate from SEOPress to SureRank SEO
- How to Migrate from Squirrly SEO to SureRank
- How to Migrate from All in One SEO (AIOSEO) to SureRank
- How to Migrate from Slim SEO to SureRank
- Migration Failed: How to Diagnose
- After You Migrate: Verification and Cleanup Checklist
- Sitemaps in SureRank
- How to Enable Video Sitemap in SureRank Pro
- How to Enable the News Sitemap in SureRank
- How to Show the HTML Sitemap on Your Site in SureRank Pro
- How to Regenerate the Sitemap After Excluding a Post Type in SureRank
- Change the Sitemap URL in SureRank
- How to Enable Author Sitemap in SureRank
- How to Exclude Post Types from the Sitemap
- How to Enable the Author Sitemap and Why Authors Are Excluded (Pro)
- Editing Meta Box
- SureRank – Page SEO Checks
- Enabling Page SEO Checks in WordPress
- Image Alt Text – Automatic Optimization
- Link Manager
- Using the SureRank Front-End Meta Box
- How to Edit the Meta Title and Description for a Single Page or Post
- Controlling Indexing with Robot Instructions
- How to Set Global Title and Description Templates with Variables
- How to Set a Canonical URL and How the Canonical Field Works
- How to Fix WWW and Non-WWW Version Redirects to Improve Your SEO
- How to Fix: No H1 Heading Found on Your Homepage
- How to Fix Missing H2 Headings on Your Homepage
- Re-run Checks Button in SureRank
- Fix Critical Error: Another SEO Plugin Detected in SureRank
- Fix Warning: Site Tagline Is Not Set in SureRank
- How to Fix: Robots.txt Contains Invalid Rules in SureRank
- How to Fix Multiple SEO Plugins Detected on Your Site
- How to Fix: Homepage is Not Indexable by Search Engines
- Warning: Homepage Does Not Contain Internal Links
- How to Fix: Search Engine Title is Missing on the Page
- Page Level SEO: Broken Links Detected
- How to Fix Missing Alt Text on Images
- How to Fix Page URLs That Are Too Long
- Page Level SEO Warning: No Links Found on This Page
- Page Level SEO Warning: No Images or Videos Found
- Page Level SEO Warning: Missing Search Engine Description
- Page Level SEO Warning: No Subheadings Found on This Page
- Page Level SEO Warning: Canonical Tag is Missing
- Page Level SEO Warning: Open Graph Tags Missing
- What is Google Search Console and how does SureRank use it?
- Recommended Image Sizes
- SureRank – SEO Check Severity Guide
- Using SureRank with Other SEO Plugins – Best Practices
- Import/Export Feature – SureRank Plugin
- What is llms.txt and Does SureRank Support It?
- Does SureRank offer a keyword rank-tracking feature?
- Does SureRank Come With Google Analytics Integration?
- Email Summary in SureRank
- SureRank Role Manager
- Search Engines Not Indexing Your WordPress Site?
- Sitemap Not Showing in SureRank
- Fixing robots.txt Issues in SureRank
- Why a Working Link Is Flagged as Broken (404)
- Which Pages Are Included in Your SureRank Sitemap
- Fixing False SEO Audit Warnings Caused by Caching
- Fixing “Couldn’t Fetch” for Your Sitemap in Google Search Console
- Troubleshooting: Favicon and Logo in Google Search Results (Supported Formats and CDN Gotchas)
- Customize XML Sitemap Top Bar with surerank_sitemap_top_bar_data
- Analyze ACF Field Content with SureRank
- Preserve Modified Date During Updates surerank_freeze_modified_date
- Customize Final Title Tag surerank_final_title
- Customize Post Type Archive Title Output surerank_post_type_archive_title
- Customize Archive Page Title with surerank_archive_title
- CustomizeModify the Search Results Page Title surerank_search_title
- Customizing the 404 Page Title surerank_not_found_title
- Customizing the Title Separator surerank_title_separator
- How to Remove Archive Prefixes from Titles Using SureRank
How to Set Up and Use the SureRank Content Performance Table
The Content Analysis table shows how each page on your site is performing in Google Search: clicks, impressions, average position, and a status badge, pulled directly from Google Search Console (GSC). It’s a free feature available to every SureRank user. You don’t need SureRank Pro to use it.
From this table you can also drill into any single page to see exactly which keywords it’s ranking for, with the same performance metrics broken out per keyword.
This article covers:
- Connecting Google Search Console (if you haven’t already)
- Where to find the Content Analysis table
- How to read the columns, status badges, and trend arrows
- Viewing keyword rankings for a specific page
- Searching, filtering, and sorting
- Known limits and common empty/error states
1. Prerequisites
Before the table can show data, two things need to be true:
- Google Search Console must be connected to SureRank.
- A verified site/property must be selected from your connected Google account.
If either of these isn’t done yet, SureRank shows a setup prompt instead of the table
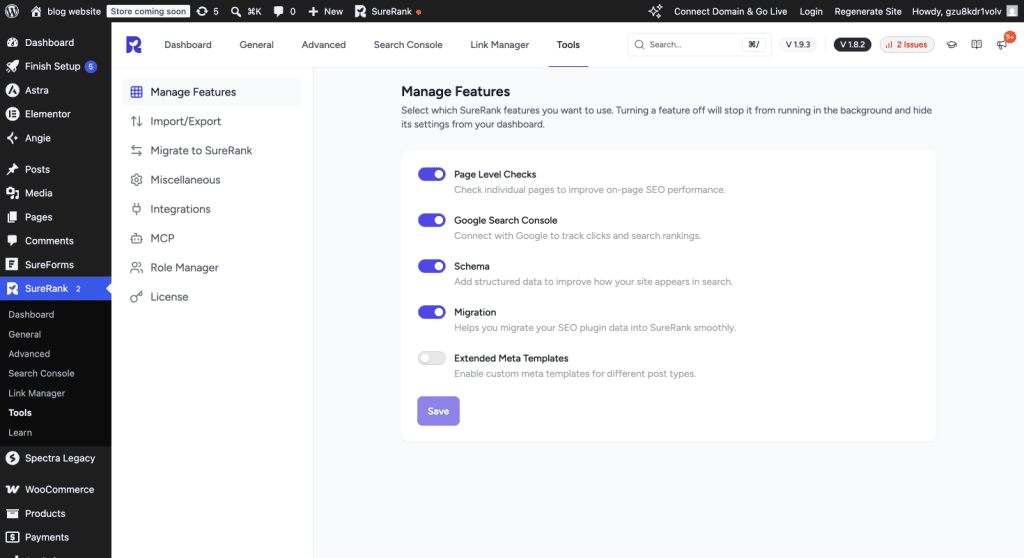
A feature toggle controls the Google Search Console integration itself. If your team has turned it off, you won’t see the Search Console section in the sidebar at all.
Go to SureRank → Tools → Manage Features and make sure Google Search Console (“Connect with Google to track clicks and search rankings.”) is enabled.
Connecting Google Search Console
- In WordPress, go to SureRank → Search Console.
- Click Connect to Search Console – It’s Free.
- You’ll be redirected to sign in with the Google account that has access to this site’s Search Console property.
- After signing in and granting access, you’re redirected back to your WordPress dashboard.
- If you have more than one property in your Google account, select the correct site from the site picker. SureRank will attempt to auto-match your current site’s URL to a verified property. If it can’t find an exact match, you’ll be asked to choose or add one manually.
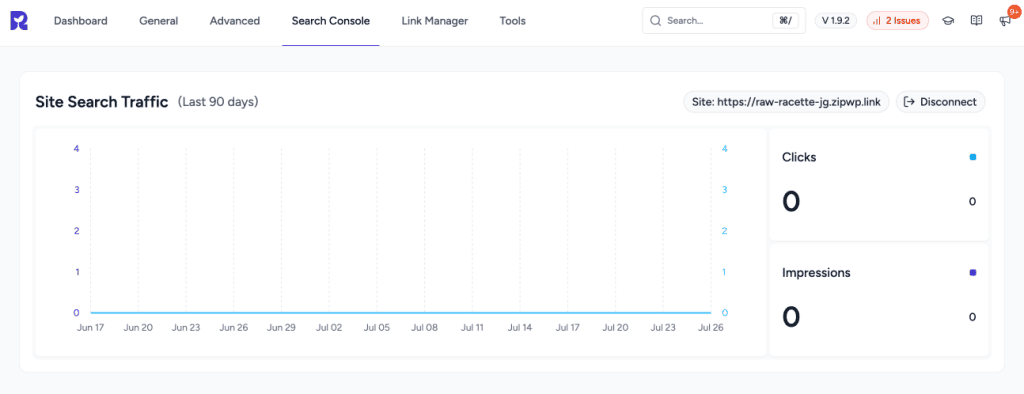
Once connected and a site is selected, data typically appears within a few minutes, though note that Google Search Console data itself is usually 2 to 3 days behind real time, and a brand-new property can take 24 to 48 hours to start showing any data at all. This is a Google limitation, not a SureRank one.
2. Where to Find the Content Analysis Table
Once Google Search Console is connected, a Search Console section appears in the SureRank sidebar with two entries:
| Menu Item | What It Shows |
| Search Console | Site-wide traffic chart, plus a short preview of the Content Analysis table (top 5 pages, with a View Full Report link) |
| Content Analysis | The full Content Analysis table, all pages, with search, filtering, and sorting |
The full table also displays a badge next to its title: (Last 90 days). This is the fixed reporting window the table uses.
3. Understanding the Content Analysis Table
Each row in the table represents one URL on your site that has search data in the selected period. The columns are:
| Column | What It Means |
| Page | The URL of the page |
| Status | A quick-read badge summarizing how well the page is ranking (see below) |
| Clicks | Total clicks from Google Search in the period (sortable) |
| Avg. Position | Average ranking position across all keywords the page appears for (sortable) |
| Impressions | How many times the page appeared in search results (sortable) |
| Keyword Rankings | A View button that opens the per-keyword breakdown for that page |
Status Badges
The Status badge is derived from the page’s average position:
| Badge | Meaning | Average Position |
| 🟢 Top Ranked | Ranking well | 1 to 10 |
| 🟡 On the Rise | Ranking, but with room to climb | 11 to 20 |
| ⚪ Low Visibility | Ranking poorly or barely showing up | 21+ |
Understanding Trend Indicators
Next to Clicks, Impressions, and Avg. Position, you’ll see a small up or down arrow showing the change versus the prior period.
- The table’s default window is the last 90 days, compared against the 90 days immediately before that. This comparison window isn’t currently user-configurable.
- For Clicks and Impressions, a green up arrow means the number increased. That’s good.
- For Avg. Position, the arrow direction is inverted to match what it actually means for your rankings: since a lower position number is better (position 1 beats position 10), an improvement in ranking is shown as a green “up” indicator even though the number went down, and a decline is shown as a red “down” indicator even though the number went up.
4. Viewing Keyword Rankings for a Specific Page
To see which search terms are driving traffic to a particular page:
- In the Content Analysis table, find the page you want to inspect.
- Click View in the Keyword Rankings column.
- A Keyword Rankings modal opens, showing every keyword this page has impressions for, with:
| Column | Meaning |
| Keywords | The search query |
| Avg. Position | Where the page ranked for that query |
| Impressions | Times shown in search results for that query |
| Clicks | Clicks earned from that query |
All columns are sortable. By default, the modal is sorted by Impressions (highest first), and shows 10 keywords per page of results.
If a page genuinely has no keyword data for the selected range, the modal shows: “No keyword rankings found for this URL. This page may not have any search queries in the selected date range.”
5. Searching, Filtering, and Sorting the Full Table
On the full Content Analysis page (not the dashboard preview), you can:
- Search: use the search box to filter rows by URL or page title.
- Filter by status: use the Status dropdown to show only All, Top Ranked, On the Rise, or Low Visibility pages.
- Sort: click the Clicks, Avg. Position, or Impressions column headers to sort ascending/descending.
The full table paginates at 20 rows per page.
6. What You’ll See If Something Isn’t Set Up Yet
| Situation | What SureRank Shows |
| Google Search Console not connected | “Once connected to Google Search Console, you’ll see how your content is performing in search engines here.” with a connect prompt |
| Connected, but no site/property selected yet | “Once a site is selected, you’ll see how your content is performing in search engines here.” |
| Connected and site selected, but no data for the period | “No content performance data available. Please check back later.” |
| A request to Google fails (rate limit, permissions, etc.) | “Oops! Something went wrong. Failed to get content performance. Please try again later. If the problem persists, please contact support.” |
If you’re on the plain Dashboard home page and haven’t connected GSC yet, you’ll see an example/preview version of the table with sample data. This is just to illustrate the feature, not real data from your site.
7. Known Limits
- The table pulls up to 500 pages per request from Google Search Console. This is the practical ceiling for how many rows can appear at once.
- The Keyword Rankings modal pulls up to 100 keywords per page.
- These are technical ceilings from the Search Console API and aren’t tied to Free vs. Pro. There’s no plan-based cap or “upgrade to see more” limit on this table itself.
- Data reflects Google’s own reporting delay (typically 2 to 3 days) and isn’t real-time.
FAQ
Do I need SureRank Pro to use this?
No. The Content Analysis table, status badges, trend arrows, and Keyword Rankings modal are all part of the free plugin.
Why don’t my numbers match Google Search Console exactly?
They should match closely, since SureRank queries the same Search Console data. Small differences can come from timing (Google’s data updates with a delay) or from the date range SureRank uses (fixed at last 90 days vs. previous 90 days) versus whatever range you have selected directly in Search Console.
Can I change the 90-day comparison window?
Not currently. The last-90-days vs. previous-90-days comparison is fixed and not user-configurable in the UI.
A page I know gets traffic isn’t in the table. Why?
The table only lists pages that have Search Console impression/click data for the selected 90-day window. A page with no search impressions in that window won’t appear. Also check that you haven’t filtered it out with the search box or Status dropdown.
I disconnected and reconnected the Search Console. Will my history come back?
Yes. The table always pulls fresh data directly from Google Search Console for the active date range. It isn’t stored locally, so reconnecting to the same verified property restores the same data.
We don't respond to the article feedback, we use it to improve our support content.